5. Mutations on gene trees#
This section will describe how to interpret gene trees with mutations.
The image at the top of Fig. 5.1 is the gene tree from Fig. 4.5. We have added mutations to the tree, which are indicated in red. The mutations are placed on the branch of the tree where they occurred and given arbitrary integer identifiers. This panel shows us a lot of detail about the evolutionary history:
This gene tree is not simplified.
Therefore, we see that a mutation is placed in between two nodes on a branch that corresponds to a specific meiosis.
For example, the mutation labelled 3 occurs on the branch between individuals 26 and 32.
This mutation therefore occurred during meiosis in individual 26 and was first present in individual 32.
The second two rows of Fig. 5.1 indicate the subtrees that correspond to two of the mutations. To obtain the subtree, we first start at a mutation. Then, we move towards the present day (the bottom of the trees image) and follow each branching point until we get to individuals born zero generations ago. Along the way, we change the color of each branch from black to red.
Note that the two subtrees differ in size! The subtree for mutation 2 leads to 5 alleles present in individuals born zero generations ago. The subtree for mutation 3 leads to 9 alleles present in individuals born zero generations ago. Further, these two subtrees lead to some of the same present-day alleles. Let’s combine these ideas:
Present day alleles in a subtree carry a copy of the mutation[1].
An allele carries a copy of each mutation for every subtree that it is in. For example, allele 110 found in individual 55 carries both mutations 2 and 3.
We can further note that:
The number of copies of a mutation in the present day depends on the number of alleles that are tips of the subtree.
The number of copies will roughly correspond to the age of the allele. Mutations that arose longer ago are deeper in the tree (farther back in the past) and will be ancestral to large subtrees.
Attention
Test yourself! Now is a good time to test yourself:
How many present-day geomes inherit mutation 0 in the top image of Fig. 5.1?
What about mutations 1, 4, and 5? (Consider them separately.)
The node labels in this image follow our
individual: genomeconvention. Therefore, you should be able to figure out which individuals:Are heterozygous for mutation 2
Are homozygous for mutation 2
Are heterozygous for mutation 3
Are homozygous for mutation 3
As an added test, you can work out the two-locus genotypes considering mutations 2 and 3 together.
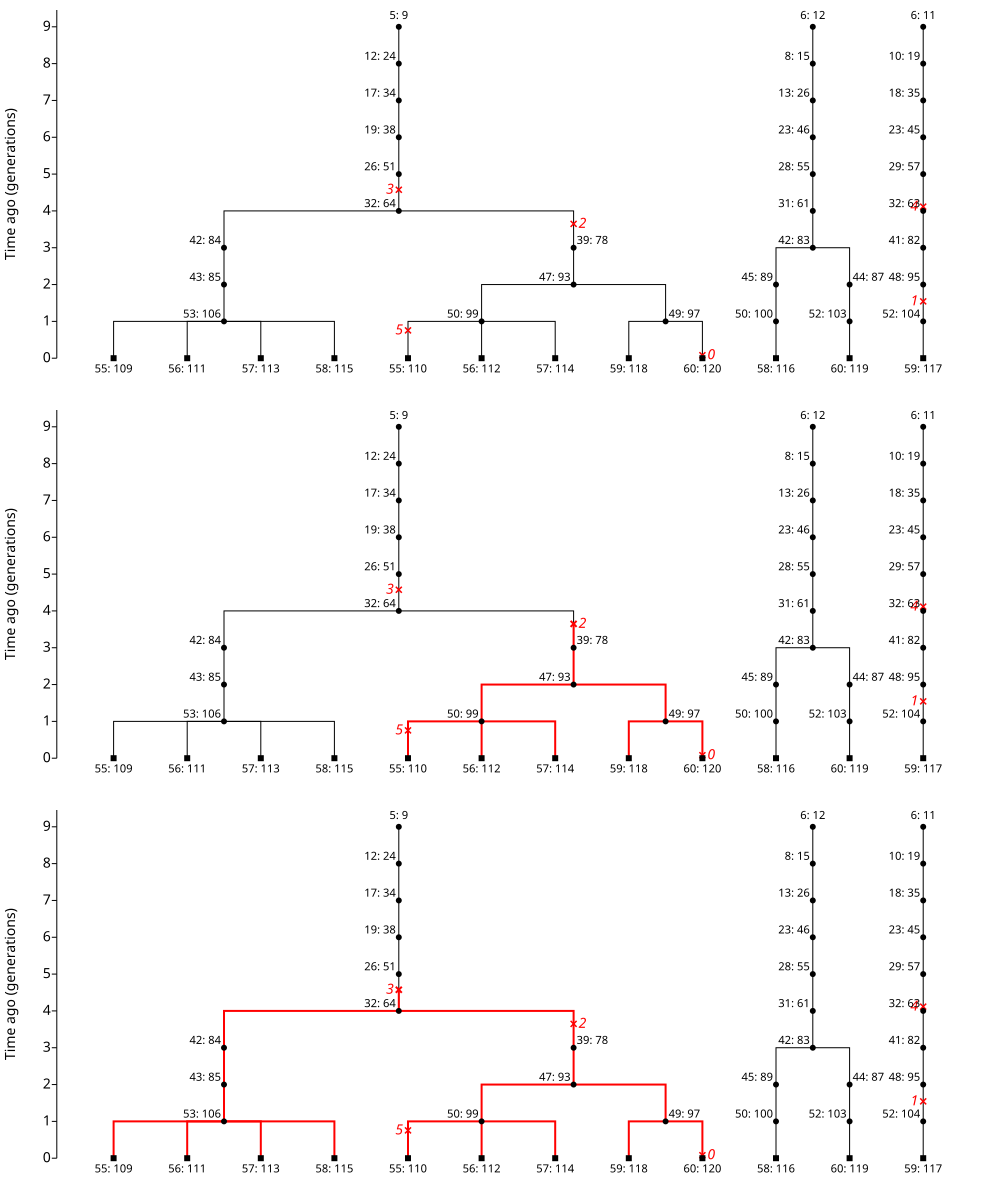
Fig. 5.1 Mutations on gene trees. The top image is the gene tree from Fig. 4.5. (That gene tree is based on simulating gene dropping on the pedigree shown in Fig. 4.4.) The gene tree has had 6 mutations added. The mutations are shown in red on the branches where they occur and are labelled with integers. The middle image is the subtree that is defined by the descendants of mutation 2. The bottom image is the subtree that is defined by the descendants of mutation 3.#
Fig. 5.2 shows the simplified version of the uppermost image of Fig. 5.1. By removing unary nodes, etc., we lose the precise details about when each mutation originated. In practice, we usually do not have access to genetic information from all individuals in a pedigree. Therefore, this figure is a bit closer to our empirical reality.

Fig. 5.2 Simplified representation of the top image from Fig. 5.1. While unary transmissions have been removed, there are branches connecting most recent common ancestor nodes to mutations. These branches are not edges because they do not end in a node! Rather, they are a plotting device that connects when a mutation happened in the past to the most ancient node descending from the mutation event.#