Snowdrift model in python#
A Python implementation of the model described in [DHK04]. See here for how to implement genetic value calculations in Python.
Implementing this model in C++ gives much better performance with little difference in code complexity. See here for the C++ version.
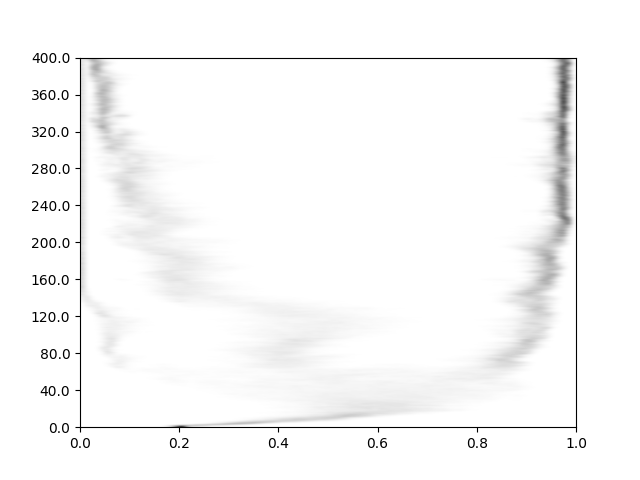
Fig. 4 Example output from the script. The y axis values are simple indexes of sampling events. Sampling occurrs every 100 generations, so multiply by that value for the generation.#
"""
Simulates the dynamics of Figure 1A from
DOI: 10.1126/science.1101456.

Final output is a plot of the phenotypes
over time, based on sampling every 100
generations.
"""

import math
import sys

import attr
import matplotlib.pyplot as plt
import numpy as np

import fwdpy11


@attr.s()
class PySnowdrift(fwdpy11.PyDiploidGeneticValue):
    b1 = attr.ib()
    b2 = attr.ib()
    c1 = attr.ib()
    c2 = attr.ib()
    slope = attr.ib()  # "stretch" parameter for sigmoid function
    p0 = attr.ib()  # Phenotype of a mutant-free individual
    seed = attr.ib()

    def __attrs_post_init__(self):
        fwdpy11.PyDiploidGeneticValue.__init__(self, 1, None, None)
        self.phenotypes = []
        self.sig0 = (1.0 / self.slope) * math.log(self.p0 / (1.0 - self.p0))
        self.rng = fwdpy11.GSLrng(self.seed)

    def genetic_value_to_fitness(
        self, data: fwdpy11.DiploidGeneticValueToFitnessData
    ) -> float:
        zself = self.phenotypes[data.offspring_metadata.label]
        other = int(fwdpy11.gsl_ran_flat(self.rng, 0, len(self.phenotypes)))
        while other == data.offspring_metadata.label:
            other = int(fwdpy11.gsl_ran_flat(self.rng, 0, len(self.phenotypes)))
        zpair = zself + self.phenotypes[other]
        a = 1.0 + (
            self.b1 * zpair
            + self.b2 * (zpair**2)
            - self.c1 * zself
            - self.c2 * (zself**2)
        )
        return max(a, 0.0)

    def calculate_gvalue(self, data: fwdpy11.PyDiploidGeneticValueData) -> float:
        g = self.phenotypes[data.offspring_metadata.label]
        memoryview(data)[0] = g
        return g

    def sigmoidize(self, g: float) -> float:
        return 1.0 / (1.0 + math.e ** -(self.slope * (g + self.sig0)))

    def phenotype(
        self, pop: fwdpy11.DiploidPopulation, metadata: fwdpy11.DiploidMetadata
    ) -> float:
        """
        An individual's phenotype is determined by additive effects
        plus a sigmoid function that bounds trait values on [0, 1]
        and places a non-mutant individual at trait value self.p0.
        """
        g = fwdpy11.strict_additive_effects(pop, metadata)
        return self.sigmoidize(g)

    def update(self, pop: fwdpy11.DiploidPopulation) -> None:
        self.phenotypes = [self.phenotype(pop, d) for d in pop.diploid_metadata]


class GetP(object):
    def __init__(self):
        self.data = []

    def __call__(self, pop, sampler):
        if pop.generation % 100 == 0.0:
            md = np.array(pop.diploid_metadata, copy=False)
            self.data.append(np.array(md["g"]))


def plot_trait_values(
    vals, bins=100, interpolation="bicubic", vmin=None, vmax=None, tmult=1
):
    parr = np.array(vals)
    nruns = parr.shape[0]

    phist = np.zeros((nruns, bins))
    for i in range(nruns):
        ph, xe = np.histogram(
            parr[i].ravel(),
            bins=bins,
            range=[0.0, 1.0],
        )
        phist[i] = ph

    plt.imshow(
        phist,
        aspect="auto",
        interpolation=interpolation,
        origin="lower",
        cmap=plt.cm.binary,
        extent=(min(xe), max(xe), 0, nruns),
        vmin=vmin,
        vmax=vmax,
    )
    plt.yticks(
        np.around(np.linspace(0, nruns, 11), -1),
        np.around(np.linspace(0, (nruns - 1) * tmult + 1, 11), -1),
    )
    plt.savefig("pysnowdrift.png")


# Branch point will be at 0.6
gv = PySnowdrift(6.0, -1.4, 4.56, -1.6, 10.0, 0.2, int(sys.argv[2]))


pdict = {
    "nregions": [],
    "sregions": [fwdpy11.GaussianS(0, 1, 1, 5e-3)],
    "recregions": [],
    "rates": (0, 1e-2, None),
    "demography": fwdpy11.DiscreteDemography(),
    "simlen": 40000,
    "gvalue": gv,
    "prune_selected": False,
}


params = fwdpy11.ModelParams(**pdict)
pop = fwdpy11.DiploidPopulation(5000, 1.0)
rng = fwdpy11.GSLrng(int(sys.argv[1]))
r = GetP()
fwdpy11.evolvets(rng, pop, params, 100, r)
plot_trait_values(r.data)