The multivariate lognormal distribution#
Show code cell source
import demes
import demesdraw
import fwdpy11
import numpy as np
If \(X\) is a multivariate Gaussian distribution, \(N(\mathbf{\mu}, \mathbf{\sum})\), where \(\mathbf{\mu}\) is a vector of mean values and \(\mathbf{\sum}\) is the covariance matrix, then \(Y = e^X\) is a multivariate lognormal random variable with mean \(E[Y]_i = e^{\mu_i + \frac{1}{2}\sum_{ii}}\) and covariance matrix \(Var[Y]_{i,j} = e^{\mu_i + \mu_j + \frac{1}{2}(\sum_{ii} + \sum_{jj})}(e^{\sum_{ij}}-1)\).
To specify a multivariate lognormal distribution of effect sizes, we use
the static class method fwdpy11.LogNormalS.mv(). The following code
constructs a distribution of effect sizes such that -2Ns (where N is the
size of a single deme) is a multivariate lognormal with means zero and an
identity matrix as a covariance matrix used to specify the multivariate
Gaussian kernel.
mvdes = fwdpy11.mvDES(
    fwdpy11.LogNormalS.mv(0, 1, 1, scaling=-200), np.zeros(2), np.identity(2)
)
Note
The lognormal distribution returns deviates \(> 0\).
To model deleterious mutations/effect sizes < 0, use the
scaling parameter with a negative value like we just did!
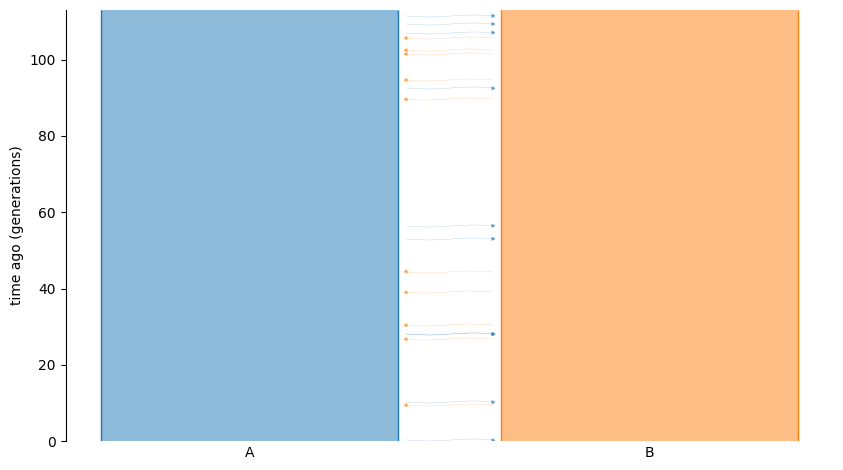
Let’s put it in a simulation and run it. We will simulate a demographic model of migration happening into the infinite past of two equal-sized demes:
Show code cell source
yaml = """
description: Island model forever
time_units: generations
demes:
  - name: A
    epochs:
     - start_size: 100
  - name: B
    epochs:
     - start_size: 100
migrations:
  - demes: [A, B]
    rate: 0.10
"""
g = demes.loads(yaml)
model = fwdpy11.ForwardDemesGraph.from_demes(g, burnin=1)
demesdraw.tubes(g);

pdict = {
    "nregions": [],
    "recregions": [],
    "sregions": [mvdes],
    "rates": (0, 5e-3, None),
    "demography": model,
    "simlen": model.model_duration,
    "gvalue": fwdpy11.Multiplicative(ndemes=2, scaling=2),
}
params = fwdpy11.ModelParams(**pdict)
# TODO: update this once we have a function to pull the sizes
# automatically from demes-derived models:
pop = fwdpy11.DiploidPopulation(model.initial_sizes, 1.0)
rng = fwdpy11.GSLrng(42)
fwdpy11.evolvets(rng, pop, params, 10)
assert len(pop.tables.mutations) > 0
Now, let’s print out the effect sizes in demes 0 and 1, respectively:
for i in pop.tables.mutations:
    print(pop.mutations[i.key].esizes)
[-0.00311311 -0.00282681]
[-0.00621349 -0.00201411]
[-0.01377296 -0.0185767 ]
[-0.00084441 -0.00247911]
[-0.0107324  -0.01124834]
[-0.00201952 -0.01139331]
[-0.00710887 -0.0048086 ]
[-0.00052882 -0.00724031]
[-0.00637634 -0.00197902]
[-0.00199968 -0.00308534]
[-0.04024832 -0.00494334]
[-0.00249829 -0.00445622]
[-0.00278211 -0.00062715]